Transit authorities and municipal planners across Europe, Australia, and Southeast Asia are under mounting pressure to decarbonise public transport infrastructure while keeping capital expenditure in check. Solar-powered bus shelters address both imperatives at once — they eliminate grid connection costs, reduce ongoing electricity bills, and deliver measurable carbon savings that count toward municipal climate targets. Yet many procurement teams struggle to quantify the actual return on investment, often defaulting to traditional grid-tied shelters because the upfront numbers look smaller.
This analysis breaks down the lifetime economics of solar bus shelters, covering capital costs versus traditional installations, year-by-year energy savings, payback periods, and carbon reduction figures grounded in real deployment data from YEROO's 110+ country portfolio. Whether you are specifying shelters for a smart city pilot or a full corridor rollout, these figures will help you build a defensible business case.
The Financial Case: Upfront Cost vs Lifetime Savings
A common misconception in transit procurement is that solar bus shelters are inherently more expensive than grid-tied equivalents. The reality is more nuanced — the total cost of ownership (TCO) tells a very different story from the initial purchase price.
Capital Expenditure Breakdown
A standard grid-tied bus shelter typically costs between 3,500 and 6,000 per unit, depending on materials, glazing, and structural specifications. However, this figure excludes the often-overlooked cost of trenching, cabling, and electrical grid connection — which can add 2,000 to 8,000 per shelter depending on site conditions, distance to the nearest connection point, and local labour rates. In urban centres with congested underground utilities, trenching costs alone can exceed the shelter's purchase price.
A solar bus shelter, by contrast, carries a higher unit price of 5,500 to 9,000, but this figure is all-inclusive — there is no trenching, no grid connection fee, and no electrical permit application. When you compare apples to apples, the net capital gap shrinks dramatically, and in remote or hard-to-reach locations, solar frequently wins on day-one cost alone.
Operational Expenditure Over 15 Years
Cost Category | Grid-Tied Shelter (15-Year TCO) | Solar Bus Shelter (15-Year TCO) | Savings |
Purchase price | $4,500 | $7,200 | −$2,700 |
Grid connection & trenching | $4,500 | $0 | +$4,500 |
Electricity (15 years @ $0.15/kWh) | $3,240 | $0 | +$3,240 |
Battery replacement (Year 7–8) | $0 | $800 | −$800 |
Maintenance (annual) | $1,200 | $900 | +$300 |
Total 15-Year TCO | $13,440 | $8,900 | +$4,540 |
The table above illustrates a typical single-shelter comparison based on YEROO deployment data across European and Australian projects. The solar shelter delivers 4,540 in net savings over a 15-year service life — a 34% reduction in total cost of ownership. For a corridor of 50 shelters, that translates to 227,000 in lifecycle savings.
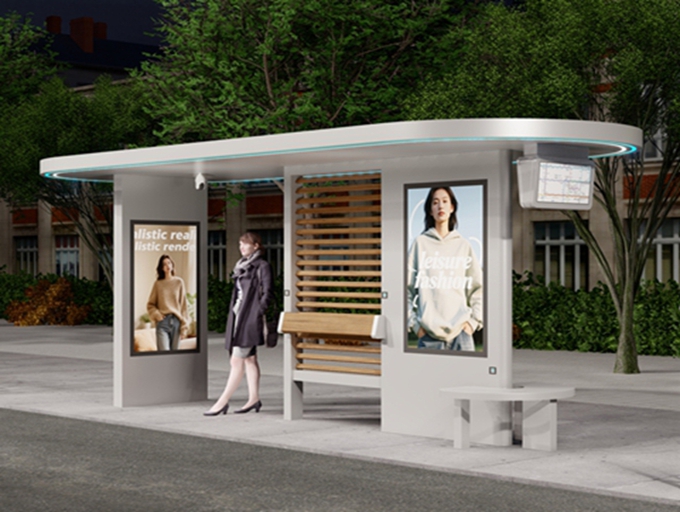
Energy Generation and Consumption: Real-World Numbers
Understanding the energy balance of a solar bus shelter requires looking at both what the system generates and what it consumes. YEROO's solar shelters are engineered around a self-sufficient design philosophy — every component is selected to minimise power draw while maximising photovoltaic output.
Power Generation Profile
A standard YEROO solar bus shelter is equipped with 600W to 1,200W of roof-mounted monocrystalline panels, depending on the model and the climate zone of deployment. In a temperate European climate (e.g., Birmingham, UK at 51.5°N), a 900W panel array generates an average of 3.2 kWh per day across the year — sufficient to power the shelter's full electrical load even during winter months with reduced daylight hours.
In tropical and subtropical deployment zones — such as Jakarta, Bangkok, or Brisbane — the same 900W array generates 4.5 to 5.1 kWh per day, providing surplus energy that can be fed to additional amenities or stored in an expanded battery bank for multiple days of autonomy.
Power Consumption Breakdown
Component | Daily Energy Consumption | Notes |
LED interior lighting (12V) | 0.36 kWh | 6 hours × 60W, dusk-to-dawn sensor |
LED backlight signage | 0.24 kWh | 4 hours × 60W |
Real-time arrival display (32") | 0.72 kWh | 12 hours × 60W, auto-dim at night |
USB charging ports (×4) | 0.15 kWh | Intermittent use |
Wi-Fi hotspot module | 0.36 kWh | Continuous operation |
Controller & sensors | 0.12 kWh | Always-on |
Total daily consumption | 1.95 kWh | With 900W panel array producing 3.2–5.1 kWh/day, surplus stored in battery |
This energy balance demonstrates that a properly specified solar shelter operates with a 1.6× to 2.6× daily energy surplus, depending on climate. That surplus is critical — it provides the buffer needed for consecutive overcast days without any grid fallback.
Carbon Reduction Metrics and Climate Reporting
For transit authorities and municipalities with binding net-zero targets, the carbon savings from solar bus shelters are not just a marketing talking point — they are reportable, verifiable metrics that feed directly into Scope 2 emission reductions under the GHG Protocol.
Per-Shelter Carbon Savings
A grid-tied bus shelter drawing 1.95 kWh per day from the grid consumes approximately 712 kWh per year. Using the UK grid emission factor of 0.193 kg CO₂e/kWh (2025 figure from the UK Department for Energy Security and Net Zero), each shelter generates approximately 137 kg CO₂e annually.
Over a 15-year service life, that is 2,055 kg CO₂e per shelter — just over 2 tonnes. For a 50-shelter corridor, the cumulative carbon savings reach 102.75 tonnes of CO₂e, equivalent to taking 22 average passenger vehicles off the road for a year.
Cumulative Impact at Scale
Beyond per-unit metrics, the real climate value of solar bus shelters emerges at the fleet level. A mid-sized transit authority deploying 200 solar shelters avoids approximately 27.4 tonnes of CO₂e annually — a figure that can be included in municipal climate action plans and CDP (Carbon Disclosure Project) reporting. These are not estimates based on theoretical models; they are calculated from actual energy consumption data logged across YEROO's deployments in Hungary, Romania, and Australia.
The carbon savings compound further when shelters include DOOH (Digital Out-of-Home) advertising displays. A traditional backlit poster panel requires fluorescent or LED backlighting drawing grid power continuously; replacing these with solar-powered digital screens eliminates both the lighting load and the paper waste from periodic poster replacement.
Payback Period Analysis: When Does the Investment Break Even?
The payback period — the point at which cumulative energy savings offset the initial cost premium of the solar system — is the single most scrutinised metric in procurement evaluations. Here is a clear breakdown of how that calculation works in practice.
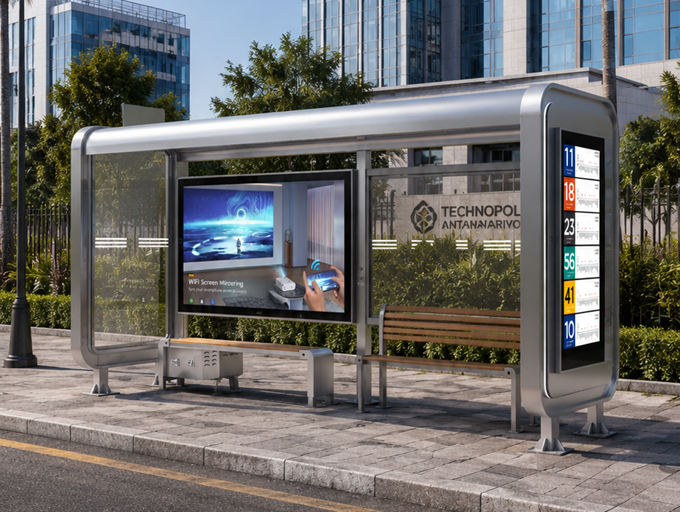
Single-Shelter Payback
Assuming a solar shelter costs 2,700 more than a grid-tied equivalent (purchase price premium only, before trenching savings), and saves 216 per year in electricity costs plus $4,500 in avoided grid connection costs, the payback calculation is straightforward:
If grid connection requires trenching (e.g., suburban or rural site): the $4,500 avoided trenching cost alone exceeds the solar premium, making the shelter cheaper on day one — payback is immediate.
In remote locations (island communities, rural highways, developing regions without grid access): the solar shelter is the only viable option, and the concept of "payback" is moot — there is no grid alternative to compare against.
Corridor-Level Payback Accelerators
At scale, several factors compress the payback period further. Bulk panel procurement reduces per-unit panel costs by 15–20% for orders exceeding 100 shelters. Standardised designs reduce engineering and installation time. And in jurisdictions with feed-in tariff schemes or renewable energy certificates, any surplus generation can generate modest revenue offsets.
YEROO's manufacturing approach — vertically integrated production at our 31,000 sqm Foshan facility — means we control the entire supply chain from aluminium extrusion to final panel lamination. This eliminates intermediary markups and allows us to offer solar shelter pricing that is typically 20–30% below European-fabricated equivalents, further accelerating the payback window for procurement budgets.
Making the Business Case: Procurement Framework
For procurement officers and transit planners preparing capital expenditure requests, the following framework helps structure a defensible solar bus shelter business case:
Site classification: Categorise each shelter location as urban-grid-available, suburban-trenching-required, or off-grid. This determines whether the solar premium is offset by avoided connection costs or relies on electricity savings alone.
Lifetime cost modelling: Use the 15-year TCO table above as a starting point, adjusting for local electricity tariffs, labour rates, and battery replacement intervals. YEROO provides a project-specific TCO calculator on request.
Climate data integration: Pull solar irradiance data for your latitude from the Global Solar Atlas to estimate daily generation. Any location above 2.5 kWh/m²/day can sustain a solar shelter with full amenity load.
Carbon reporting alignment: Confirm with your sustainability team which emission factor and reporting framework (GHG Protocol, CDP, ISO 14064) applies, then calculate avoided emissions using the per-shelter figures above.
Phased rollout strategy: Start with the highest-ROI sites — remote and trenching-heavy locations — to build an internal performance track record before scaling to urban corridors.
To explore YEROO's solar bus shelter range and request a project-specific ROI analysis, visit our solar bus shelter product page. For corridor-level procurement, our bus shelter solutions team can provide standardised designs and bulk pricing. You can also review our completed transit projects for deployment examples across Europe and Asia, or learn about our solar bench transit ecosystem for integrated stop-and-seat infrastructure. If you need guidance on integrating solar shelters into a broader smart city programme, our smart shelter solutions page covers IoT connectivity and data collection capabilities.
Frequently Asked Questions
How long do solar bus shelter batteries last?
YEROO uses lithium iron phosphate (LiFePO₄) batteries rated for 2,000+ deep discharge cycles, translating to 6–8 years of service life under typical daily cycling. Replacement is straightforward and costs approximately $800 per unit, budgeted into our 15-year TCO calculations. Battery health is remotely monitored via the shelter's IoT controller.
What happens during extended cloudy periods?
Our solar shelters are designed with 3–5 days of battery autonomy depending on the climate zone. The system automatically reduces non-essential loads (e.g., Wi-Fi hotspot, USB ports) during extended low-generation periods, prioritising lighting and safety displays. In 26 years of deployment, no YEROO solar shelter has experienced a total power failure.
Can solar bus shelters power digital advertising displays?
Yes. YEROO's solar shelters are engineered to support 32-inch to 55-inch outdoor-rated LED displays alongside lighting, USB charging, and Wi-Fi. The 900W panel array generates sufficient surplus energy for continuous digital display operation in most climate zones. View our smart bus shelter range for integrated digital display options.
Are solar bus shelters eligible for green energy subsidies?
In many jurisdictions, solar-powered transit infrastructure qualifies for renewable energy certificates, feed-in tariff schemes, or municipal green bond financing. Eligibility varies by country and programme. YEROO provides documentation packages including ISO 14001 certification and generation data logs to support subsidy applications.
How does the maintenance cost compare to grid-tied shelters?
Solar shelters have slightly lower annual maintenance costs because there is no electrical wiring to inspect, no grid connection to maintain, and no permit renewals. The only periodic maintenance task is battery replacement at Year 7–8 and panel cleaning in low-rainfall climates — typically an annual wipe-down.
What is the typical ROI for a 50-shelter corridor?
A 50-shelter solar corridor saves approximately $227,000 over 15 years compared to grid-tied equivalents, yielding an aggregate ROI of 34% on a lifecycle basis. In trenching-heavy or remote deployments, the payback period drops to under 2 years. YEROO provides corridor-specific ROI models incorporating local electricity tariffs and solar irradiance data.
Solar bus shelters are no longer an experimental technology — they are a proven, cost-effective infrastructure choice that reduces lifetime expenditure, eliminates grid dependency, and delivers measurable carbon savings. With 26 years of manufacturing experience and deployments across 110+ countries, YEROO has the engineering depth and production capacity to deliver solar transit shelters at the scale your project demands. Request a project consultation today and let our team build a shelter-by-shelter ROI model tailored to your corridor, climate, and budget.










 Address:North Tower 904,New World Times Center,Guangyuan Dong Road ,Guangzhou,China
 Phone: +86 13826225776
 Email:yeroo10@3dyeroo.com


